
Advisor Blog | Jan 2024
Definitive Data on Executive Cost Ratios
Five-year data from Pearl Meyer’s Executive Compensation and Benchmarking Survey show clear advantages for the largest companies.

It's no secret that an organization's revenue size greatly impacts the manner in which they construct their executive compensation plan, and data from Pearl Meyer's Executive Compensation and Benchmarking Survey bears this out.
The chart below displays data from the Leadership Cost Index section of the survey report, in which high level data is collected on the top two levels of the organization—CEOs and their direct reports. Specifically, the data below charts the aggregate base salary costs for the top two levels of leadership expressed as a percentage of revenue.
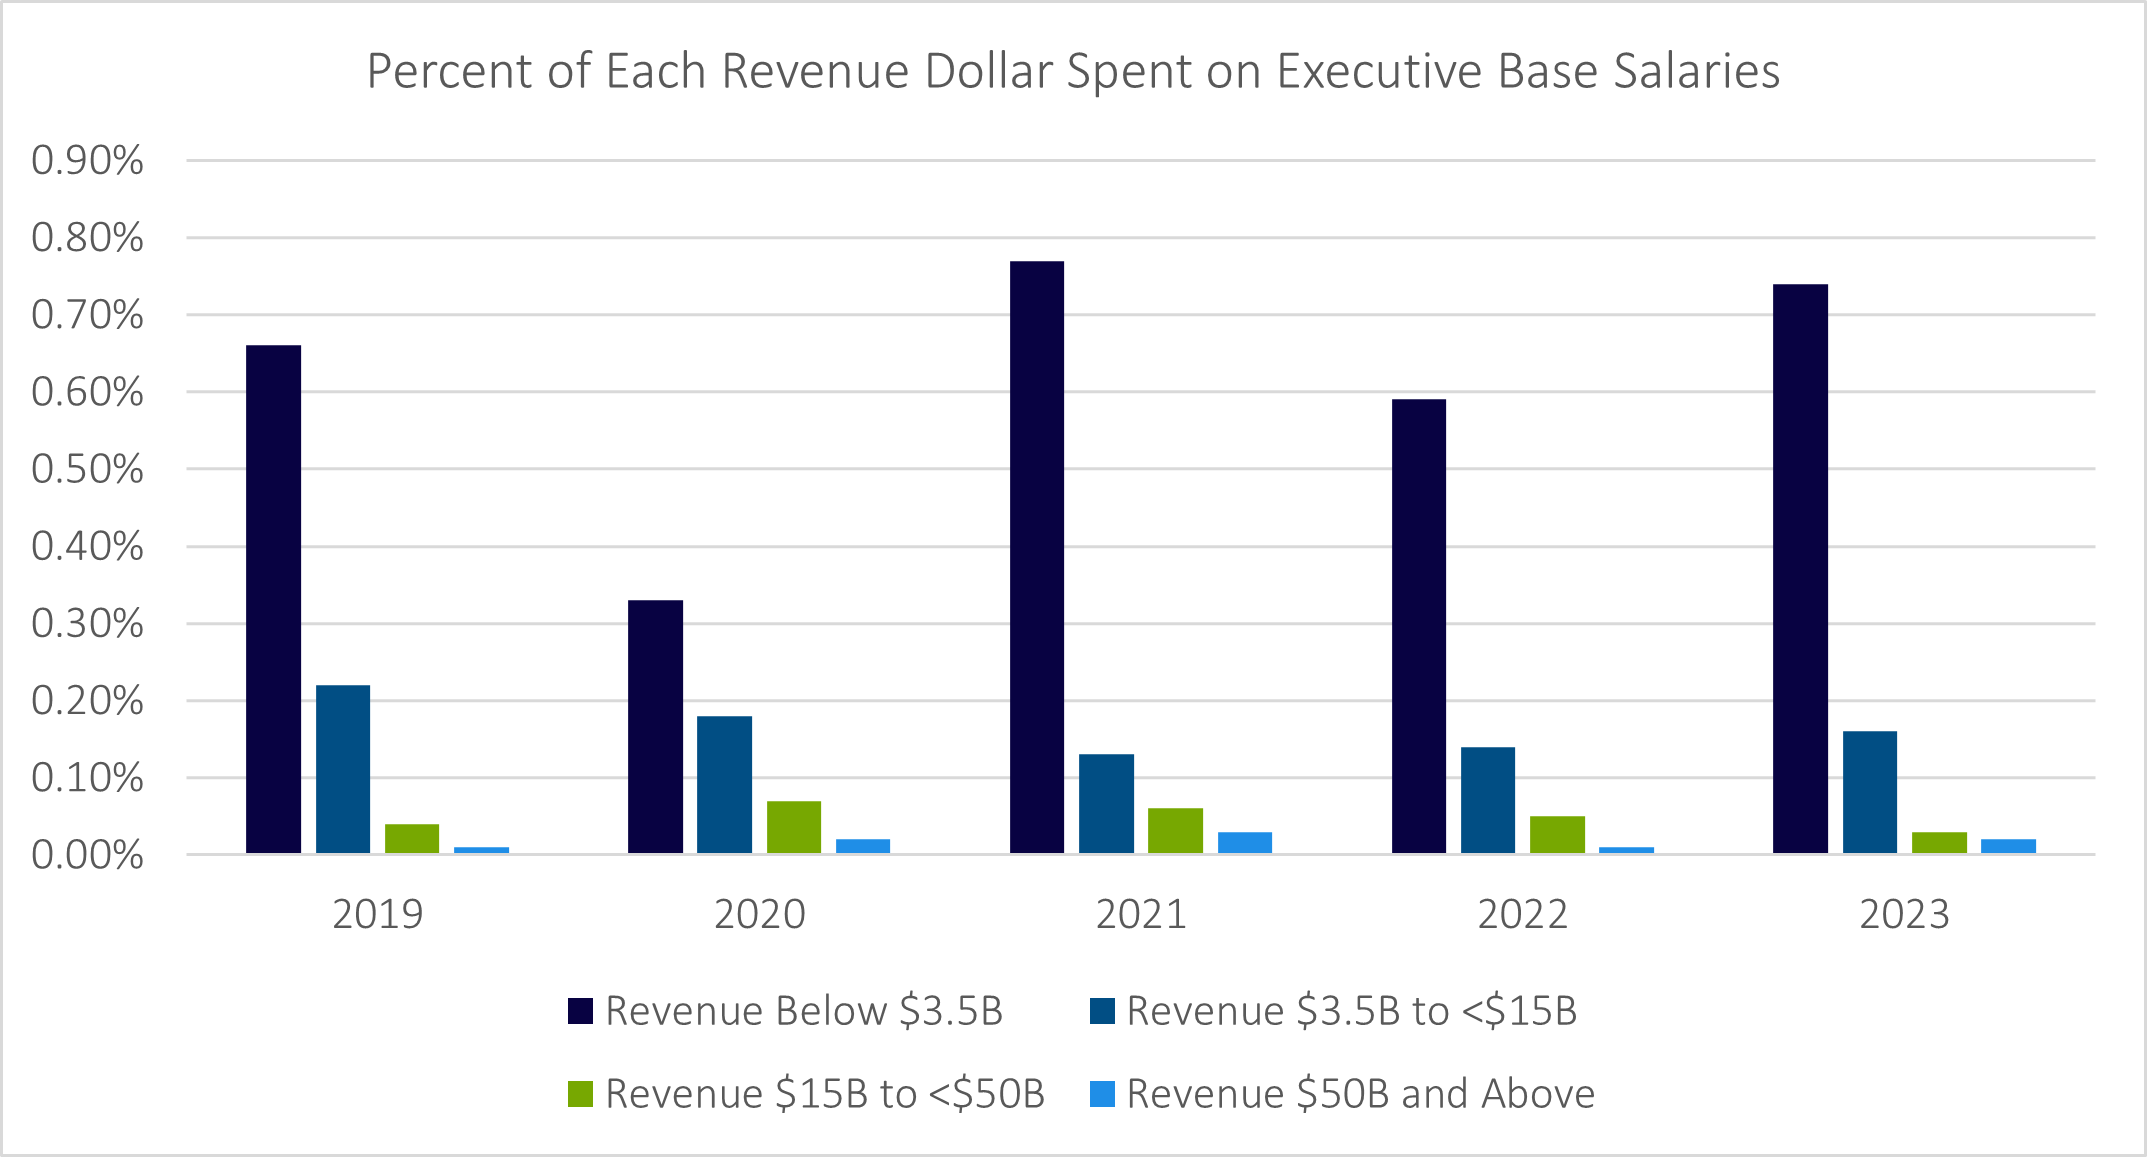
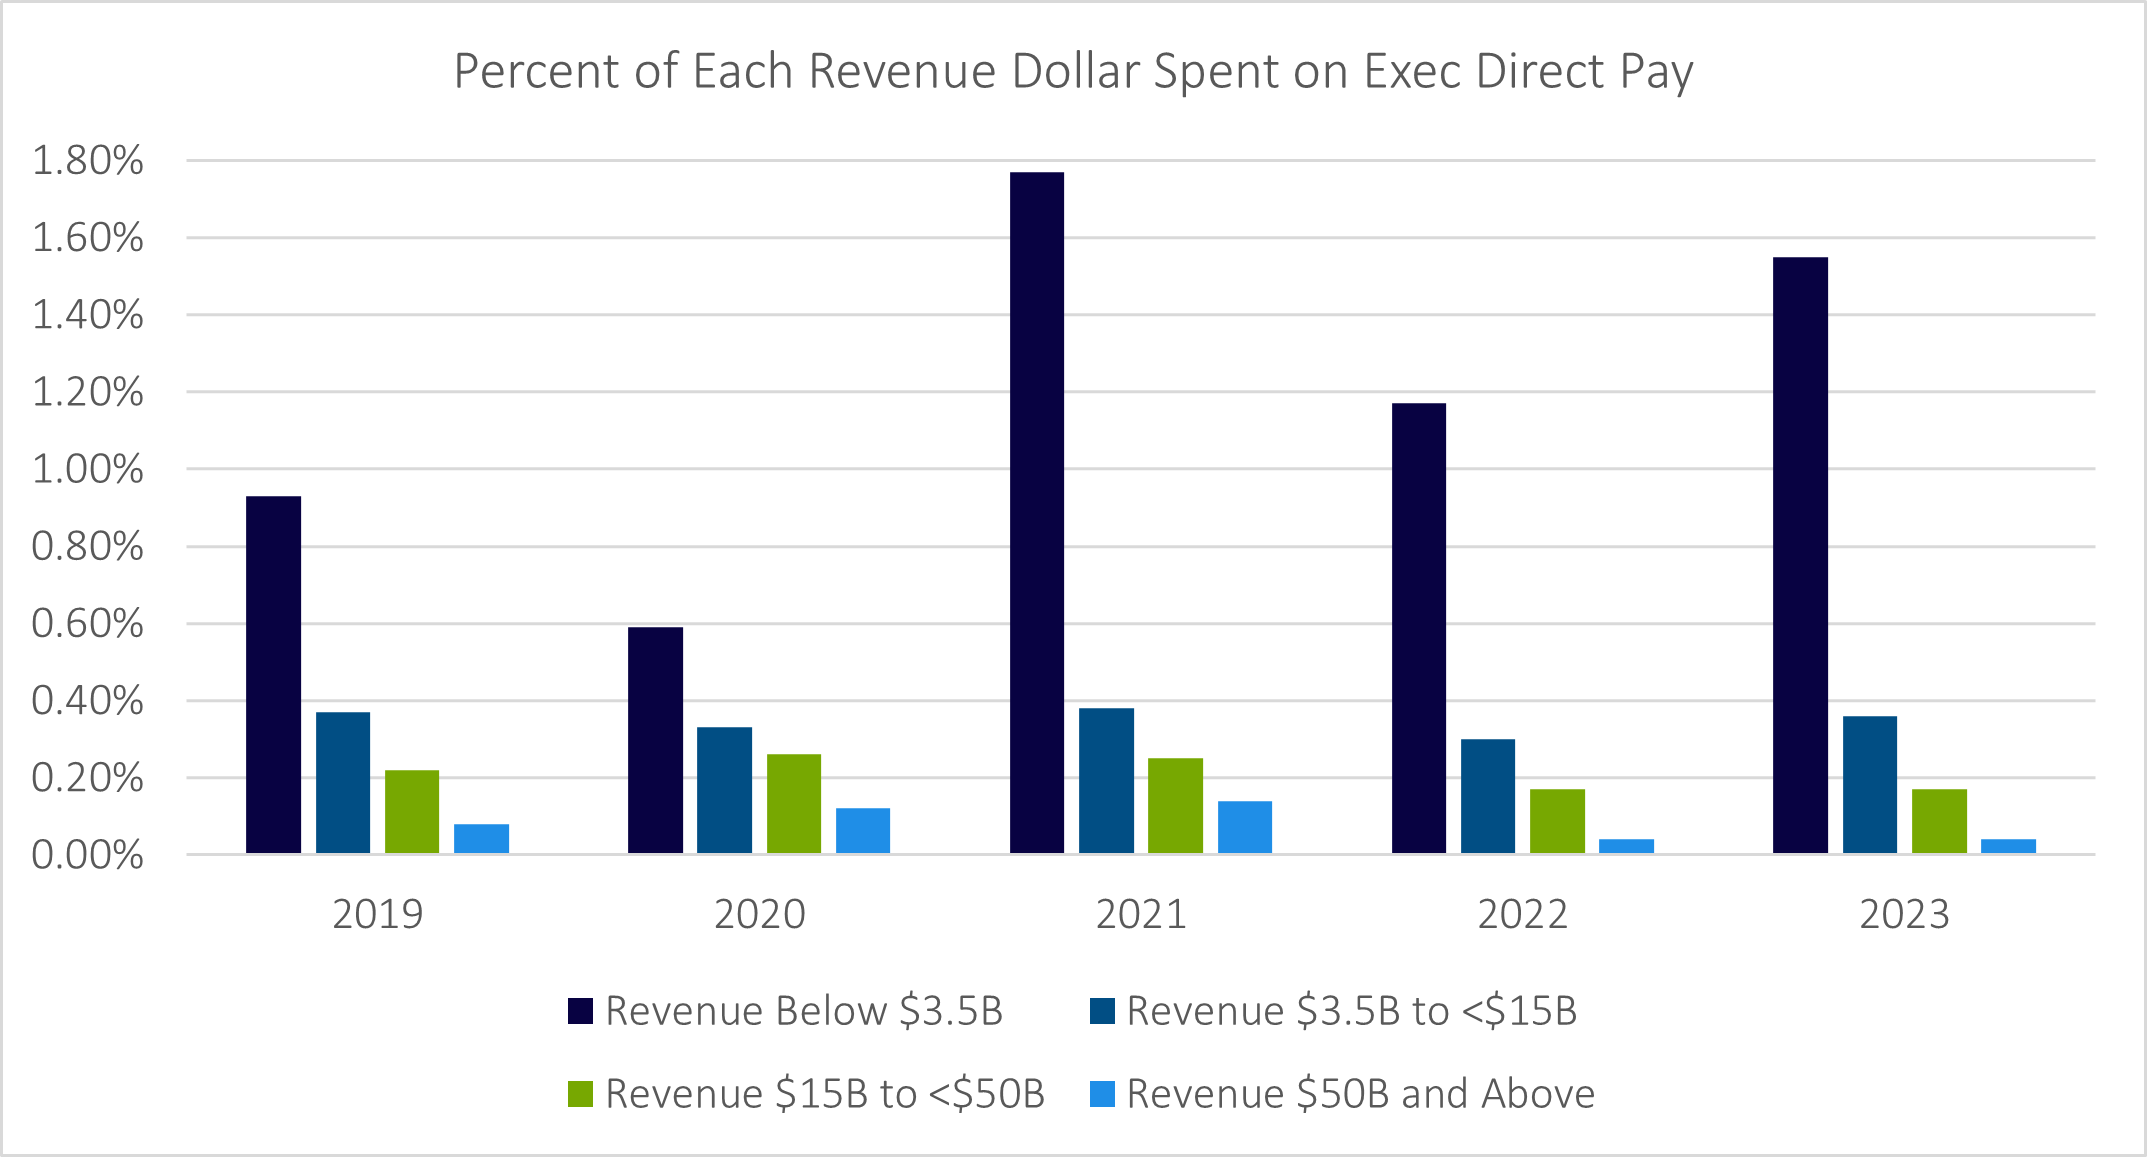
This is one more way that organizations with larger revenues enjoy a clear advantage over smaller companies: They spend far less of each dollar they generate on their executive leadership teams. This holds true even when additional components of an executive’s compensation are factored in. When examining Total Direct Compensation (TDC), which includes base salary, actual short-term incentives, and long-term incentives, the same trend persists. Relative to revenue, small organizations still spend considerably more.
The five-year consistency in this data is noteworthy and points to the structural nature of this size-based difference in cost ratios. On average, organizations in the smallest revenue bucket studied spend 41 times more of each revenue dollar on their executive leadership teams than those organizations in the largest revenue bucket. With that said, it is important to note that other factors, such as ownership type, organizational structure, and compensation philosophy may also play a role in the cost ratios discussed above.
However, an interesting trend emerges when comparing year-over-year executive base salary growth rather than total cost allocation. Each year, Pearl Meyer’s Compensation Planning Survey collects data on year-over-year executive base salary growth, among numerous other items. Data from the 2022 and 2023 editions of this survey show that recently, firms with smaller revenues have actually provided larger base salary increase percentages in each of the last two years.
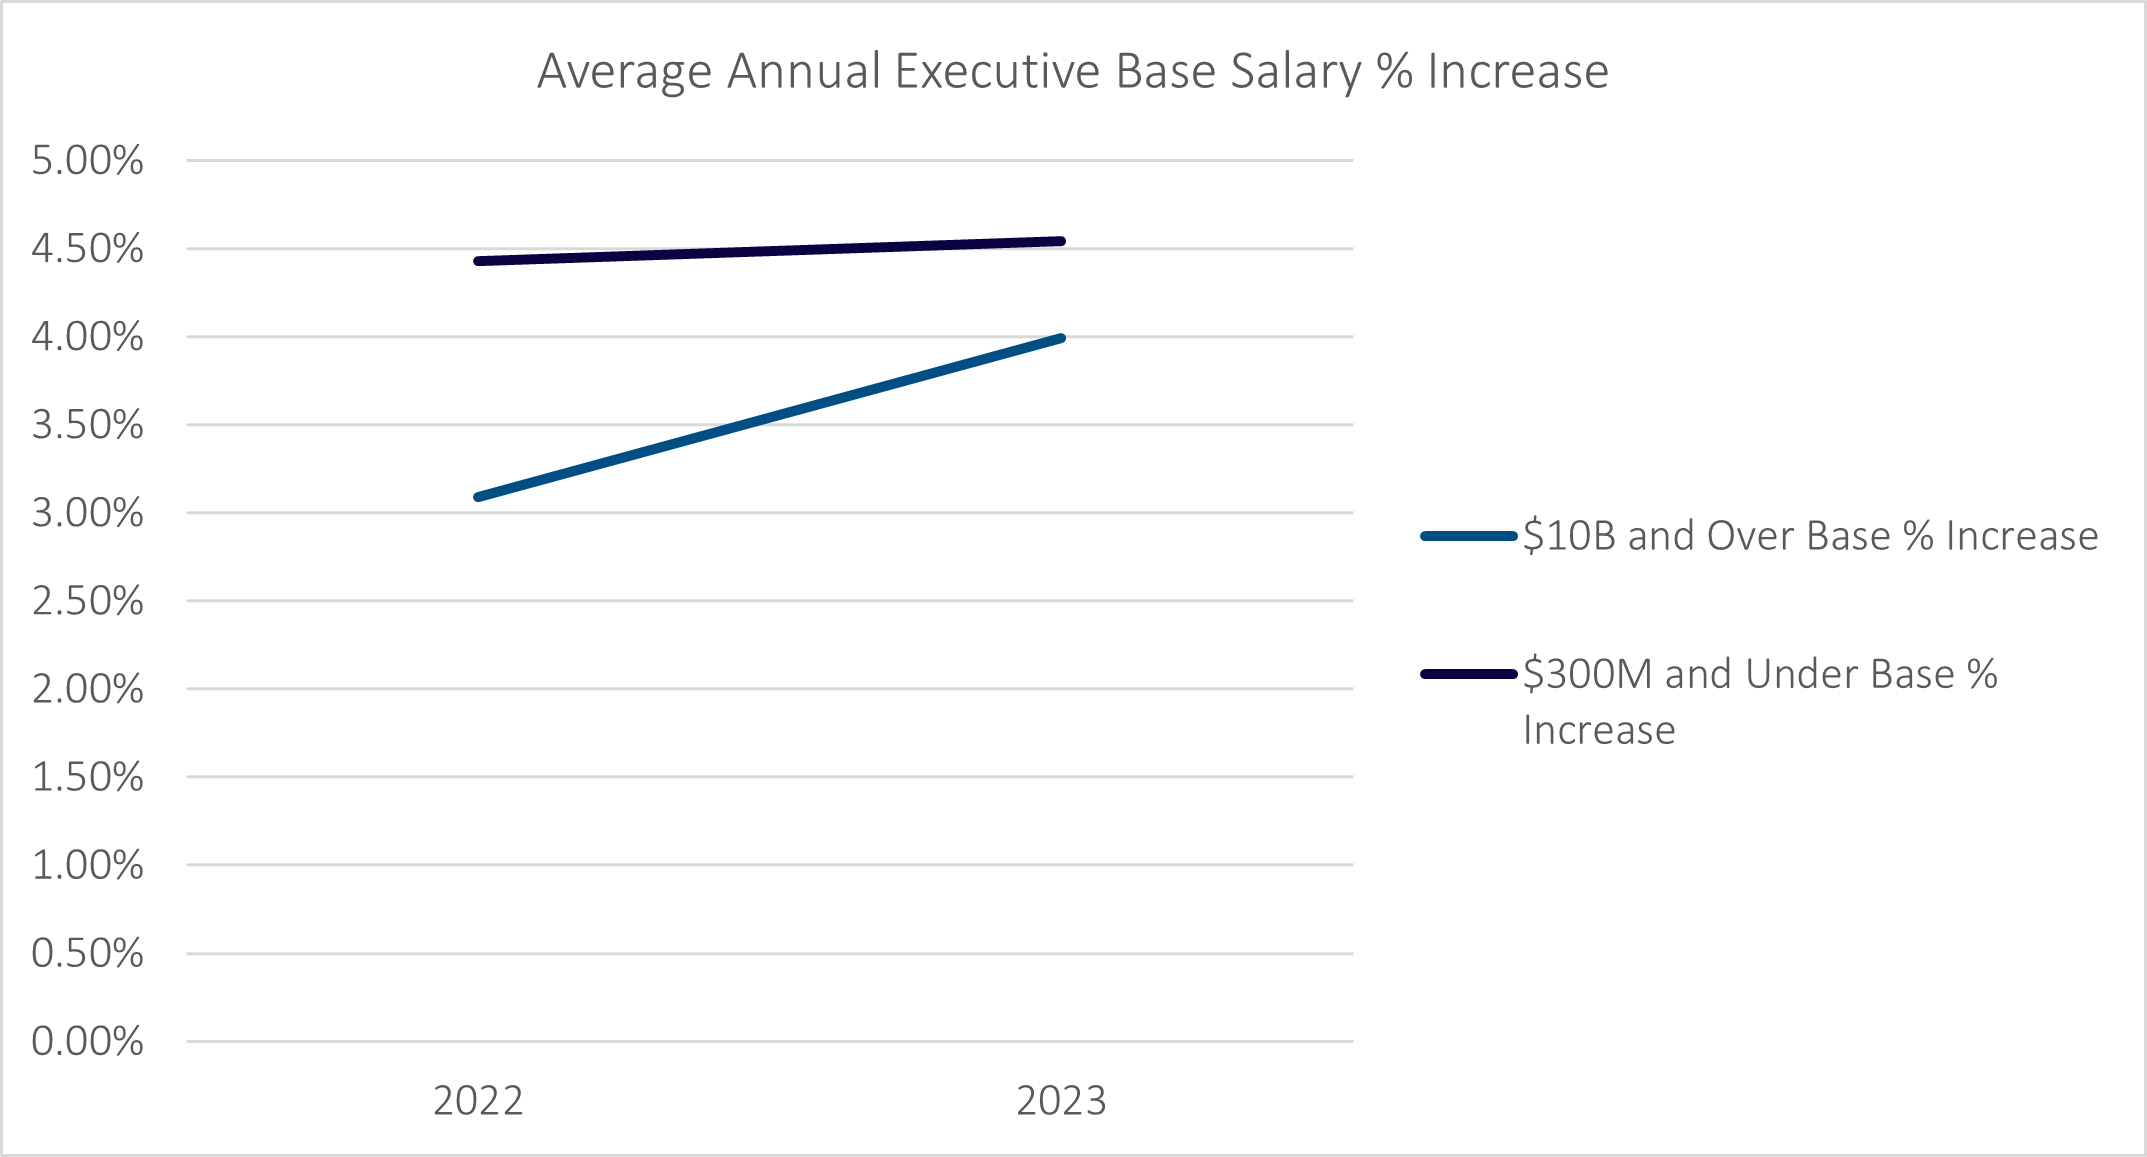
As the chart above indicates, smaller firms outpaced larger firms in terms of base salary increases in both 2022 and 2023, despite gains made by larger firms within the last year. Perhaps the reason for this gap lies in the fact that large organizations are able to leverage additional kinds of variable compensation, such as long-term incentives, to include in a total compensation package, decreasing their reliance on base salary. Of course other factors, beyond revenue size, do play a significant role in the base salary increase percentages that a company provides. Regardless, the high costs faced by smaller organizations are meaningful and it’s worth watching how year-over-year salary trends continue to move in conjunction with them.