
Advisor Blog | Mar 2023
Pay Versus Performance Watch: The First Filers
PVP disclosure data and trends based on this year’s first 60 public filings.

The pay versus performance watch is on. We are now in the throes of the first proxy season in which public US companies are required to disclose a prescribed set of descriptions, tables, and charts as dictated by the SEC and pursuant to a twelve year old Dodd-Frank mandate.
We have found many clients still struggling with completing their first Pay Versus Performance disclosures after grappling with the new rules for six months and despite the SEC’s release of some follow-on guidance in the form of FAQs last month. As each proxy is released, Pearl Meyer and Main Data Group, our executive compensation benchmarking and corporate governance analytics team (MDG), have been analyzing the data and trends in real time. Following are our initial observations on the first 60 filers (“First Filers”) as of March 10, 2023. These companies span across different industries, revenues, asset sizes, and corporate strategies. Unless otherwise noted, the analysis includes Smaller Reporting Companies, or SRCs, which have scaled disclosure. While some disclosures come as a surprise, most were fairly predictable given the complexity—and in some cases lack of specificity—in the rules. As we update on the key points so far, we will continue to provide additional updates and further research on our findings as the proxy seasons continues.
Disclosure Substance and Location
Number of Words
The rules themselves are extensive, requiring at a minimum one detailed table, one tabular table, at least four levels of comparisons of pay vs. performance (whether in narrative or graph), and potentially endless ways in which to provide narratives around the disclosure and prepare the necessary reconciliations between Summary Compensation Table (SCT) compensation and Compensation Actually Paid (CAP). When the rules were first released, many predicted this disclosure would turn into a “mini-CDA” itself, adding pages and pages of extra length and complexity to satisfy a rule that universally didn’t seem to drive compensation decision-making—at least in the first year.
Despite this apprehension, many clients and companies seemed to take a “this is a compliance exercise” approach, providing only the necessary disclosures unless they felt a further explanation of the relationships or CAP was absolutely necessary. At median, the word count (including those embedded in charts and graphs) was 1,286 words. If we assume an average of 500 words a page, this added between two and three pages of new disclosure, including graphics. At the high end, the PVP disclosure of the company that used 3,589 words was flush with detailed year-by-year reconciliations, and chock full of explanations around pay, coming close to the mini-CD&A expectations described above. At the low end with 303 words and half a page, was an SRC, which provided the bare minimum scaled disclosure.
Number of Words for Whole PVP | |
| Max | 3,589 |
| Average | 1,371 |
| Median | 1,286 |
| Minimum | 303 |
Relationship Descriptions
The rule allows companies to choose how to display the required relationships between CAP and Total Shareholder Return (TSR) of the company and also its identified peer group. (Note: SRCs are not required to show these relationships and are not considered in this analysis.) Companies were permitted to describe these relationships through narrative, graphics, or both. Not surprisingly, all non-SRC First Filers choose to present their information using graphs or bar charts. Some companies were able to condense all the relationships into one graph, while others used multiple graphs. At median, companies used three graphs (which makes sense as most companies compared CAP and both TSRs in one chart, and CAP vs. Net Income and Company Selected Measures, respectively, in the second and third charts). At the high end, one company employed eight graphs, essentially capturing not only the required relationships, but also relationships between CAP and every measure listed in their Tabular disclosure as a supplement to the discussion and their CD&A.
Number of Charts Disclosed by Companies | |
| Max | 8 |
| Average | 3 |
| Median | 3 |
| Minimum | 1 |
Location
As anticipated, all of the disclosures appeared to keep the PVP information out of the CD&A, reflecting the sentiment that the new disclosure is merely a compliance exercise and did not drive the decision-making of the compensation committee (and in most cases, could not, as the rules were issued after many 2022 decisions had been made). Placement was typically found near the CEO Pay Ratio.
Peer Groups
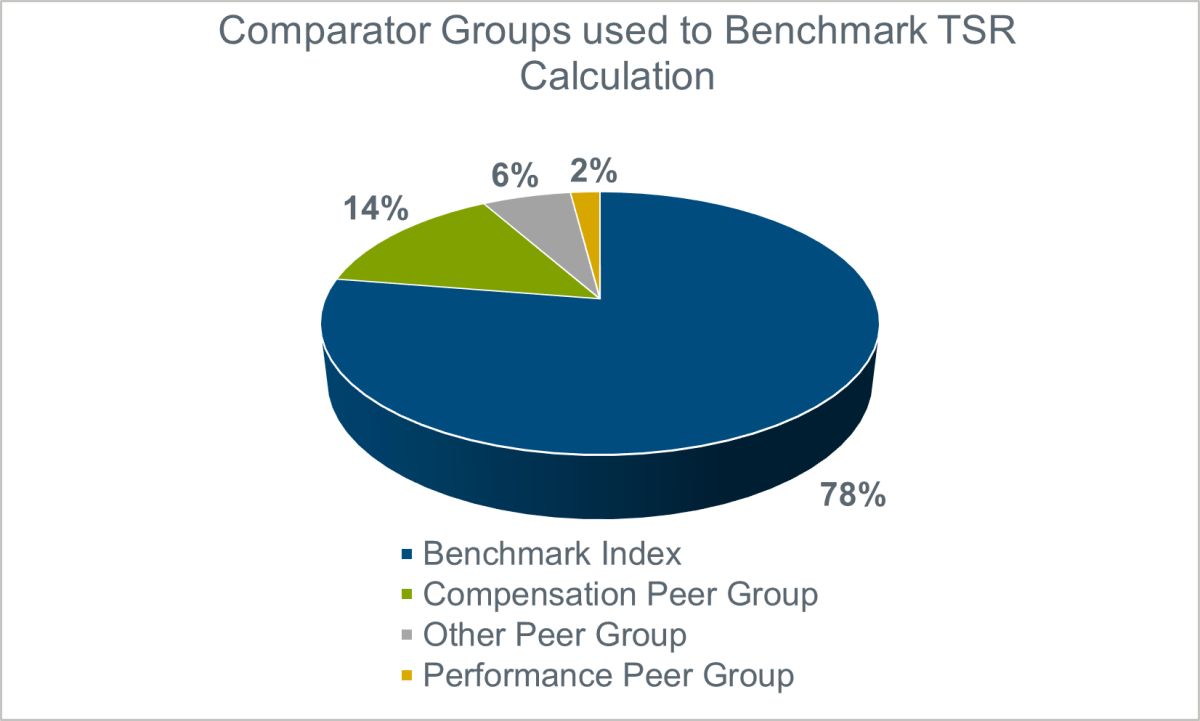
The rule requires non-SRC companies to compare their historic TSR to that of a peer group, which is generally permitted to be a benchmark index (other than a broad index) from the 10-K performance graph or a peer group disclosed in the CD&A. If the compensation peer group changes over time, the rules require a further explanation in footnotes. As such, it is not surprising that the majority of First Filers used an index (78%) while only 22% used a peer group from their CD&A. It appears that one company used a “performance peer group” from its CD&A, taking advantage of the newly released FAQ clarification permitting companies to use CD&A peer groups beyond those used for benchmarking.
Company-Selected Measure
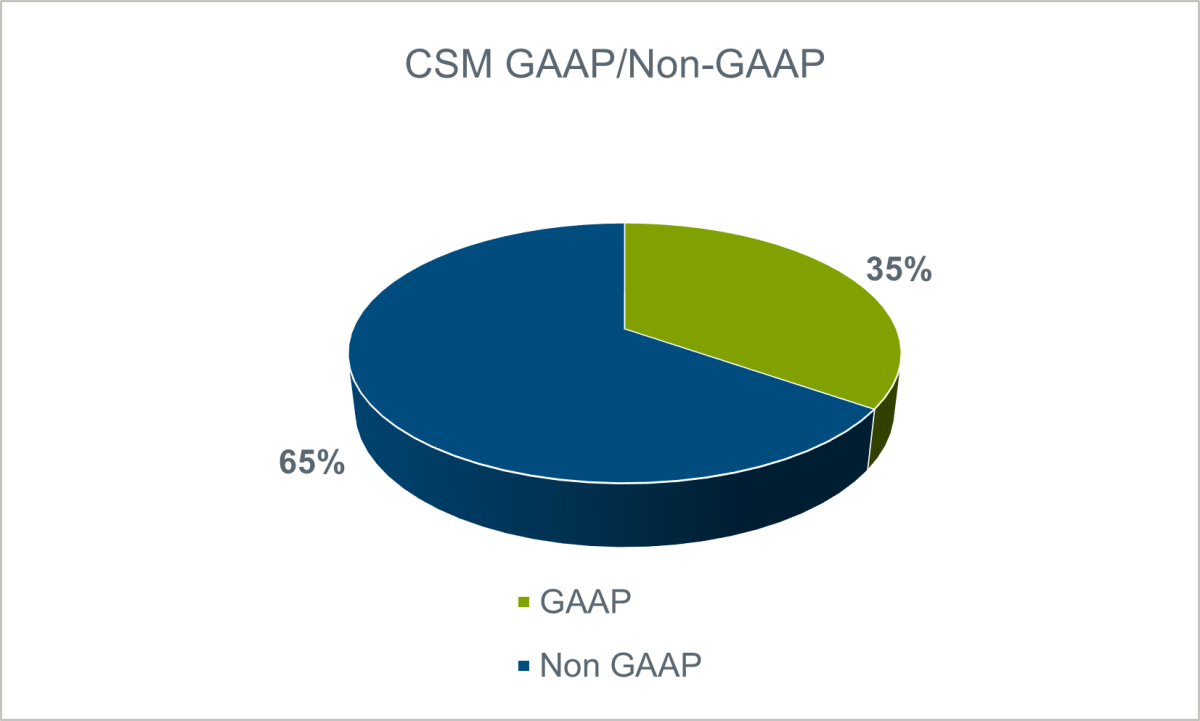
The rules require that non-SRC companies include an additional measure in their PVP tables reflecting the most important financial measure used to drive CAP (the Company-Selected Measure, or CSM). If a non-GAAP measure is used, a reconciliation is required to GAAP. As many short- and long-term programs are driven by measures that are non-GAAP, it was not surprising to see that a majority of companies (65%) used a non-GAAP measure for the CSM.
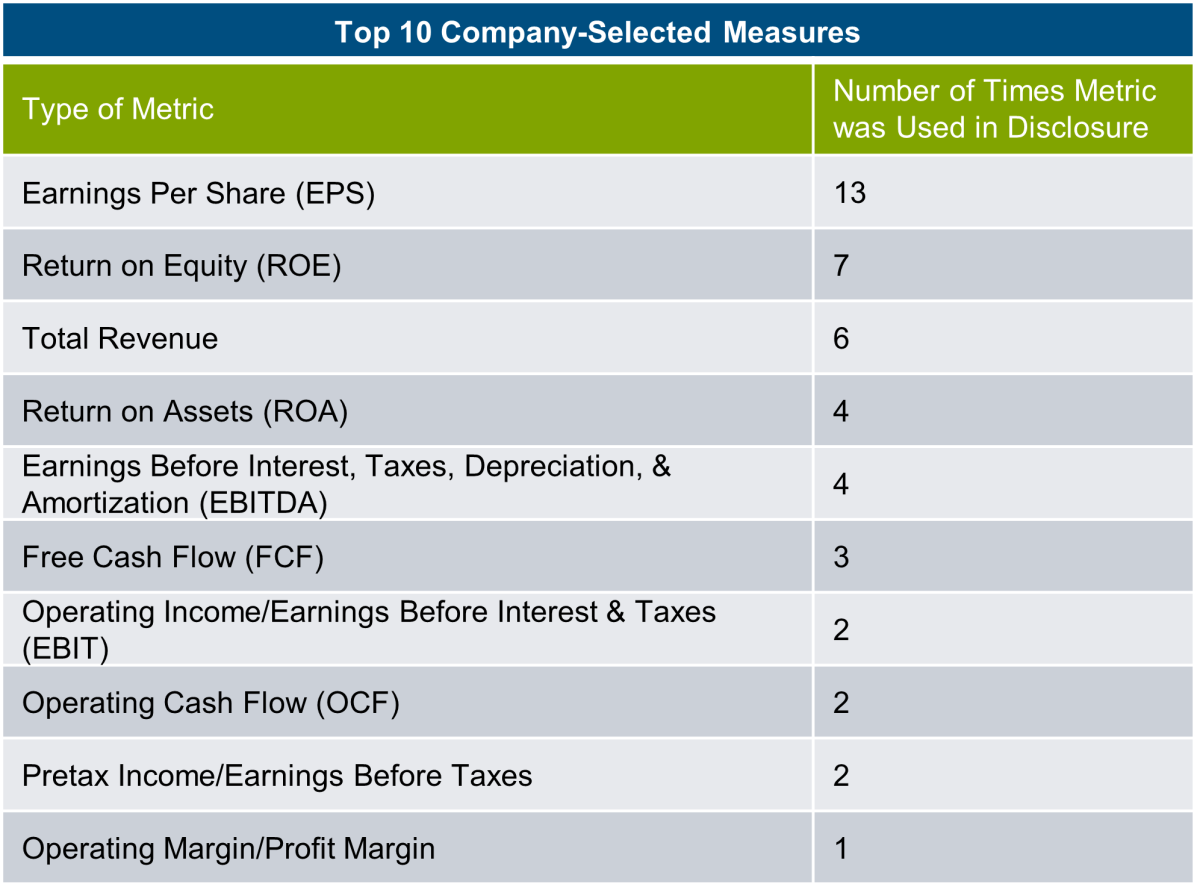
Of the First Filers, the most frequently used metric was EPS, followed by ROE and revenue. Other CSM metrics listed by First Filers are indicated below:
Tabular Measures
Number of Measures
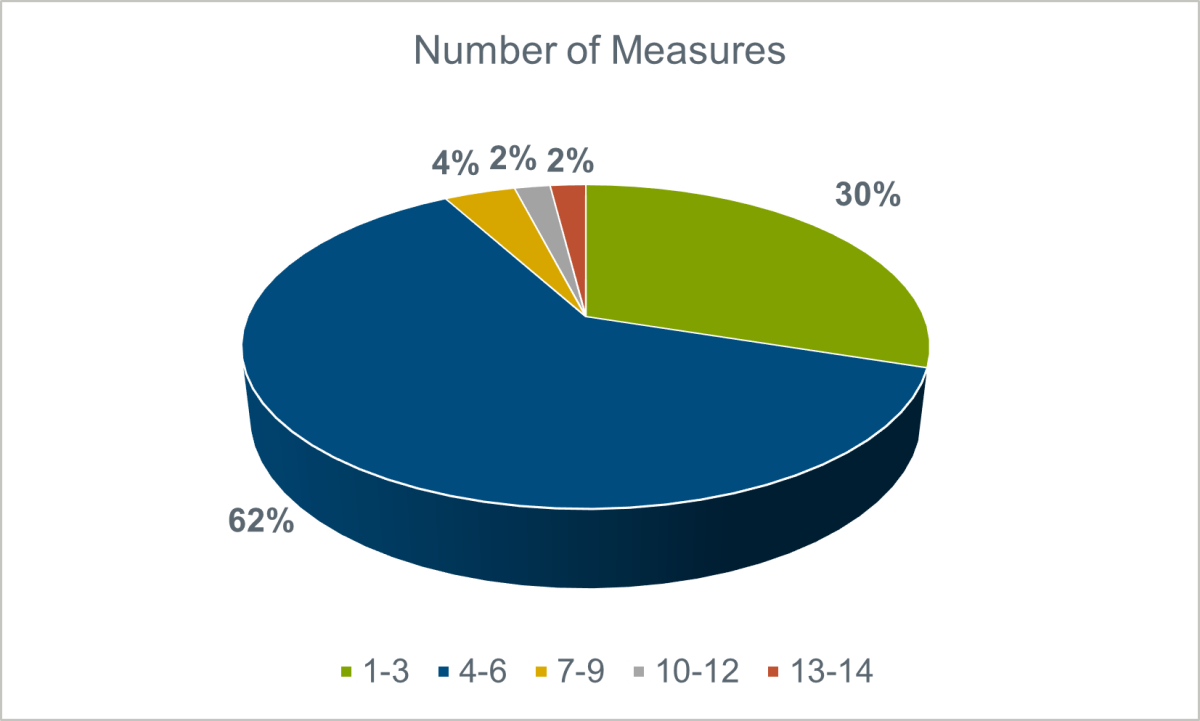
The rules require non-SRC companies to provide a simple tabular disclosure listing between three to seven of the most important measures used to drive CAP, with three of those measures preferably being financial. While we were expecting most companies to provide limited disclosure here, our study of the First Filers told a different story. At median, companies reported five measures, with one company providing 14 measures at the high end, breaking down the most important measures over three separate Named Executive Officers (NEOs).
Types of Tabular Measures
As anticipated, the vast majority (87%) of measures disclosed were financial.
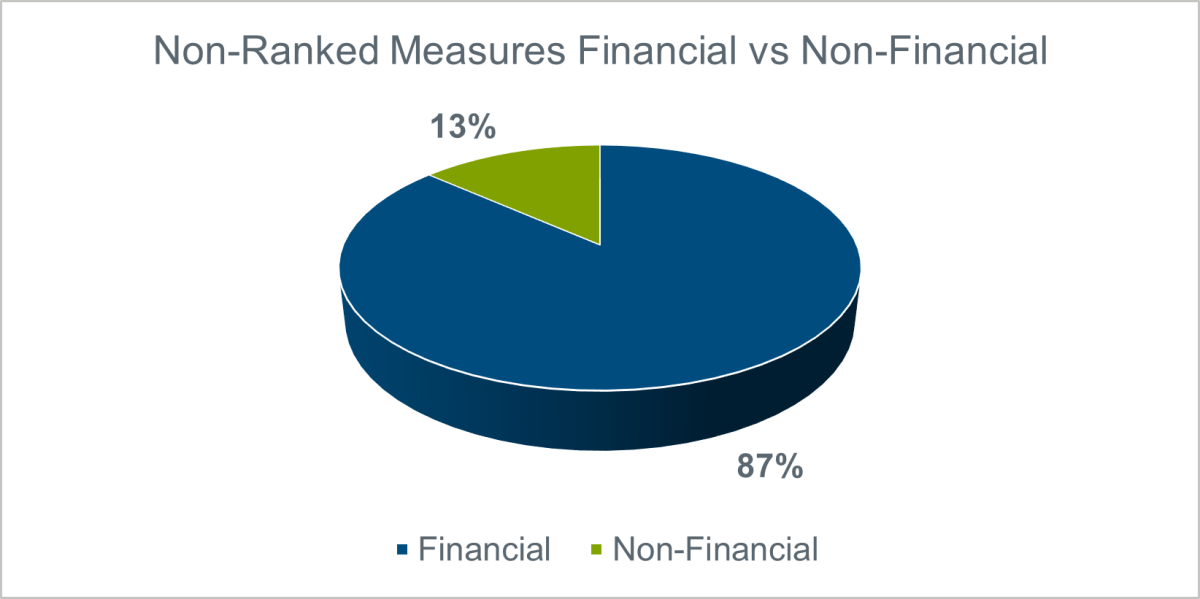
Non-financial measures were largely strategic, ESG- related, or individual in nature, which included, among others:
- DE&I goals
- Environmental success
- Individual objectives related to business strategy
- Litigation management
- Operational performance
- Oversight of risk management
- Oversight of accounting, finance, and information management
- Shareholder relations management
- Non-financial strategic measures
- Other sustainability metrics
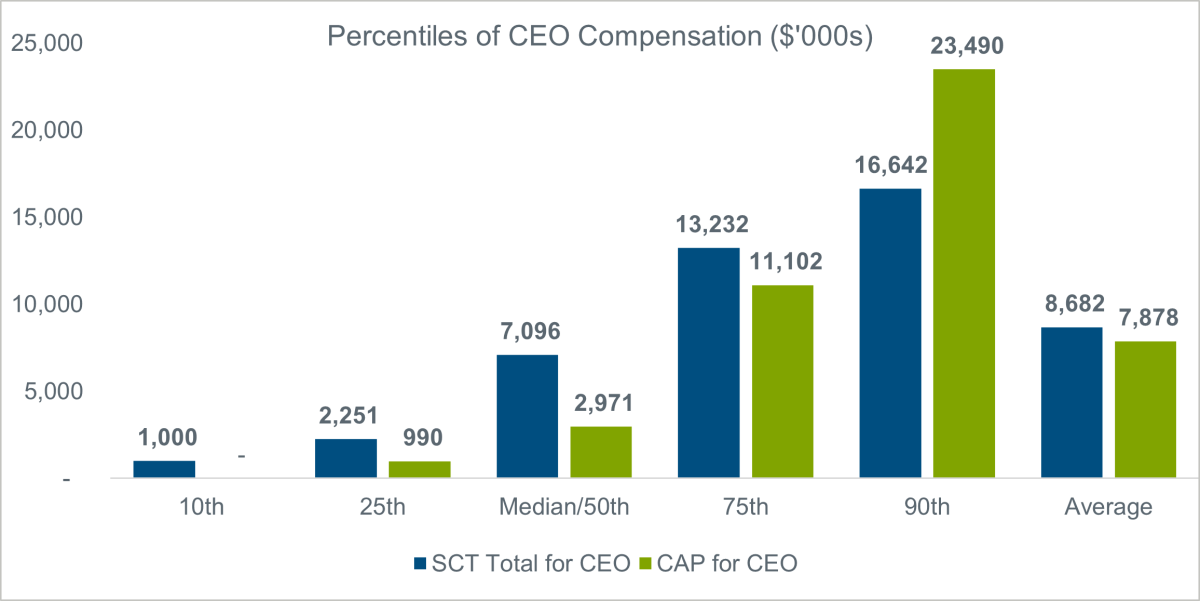
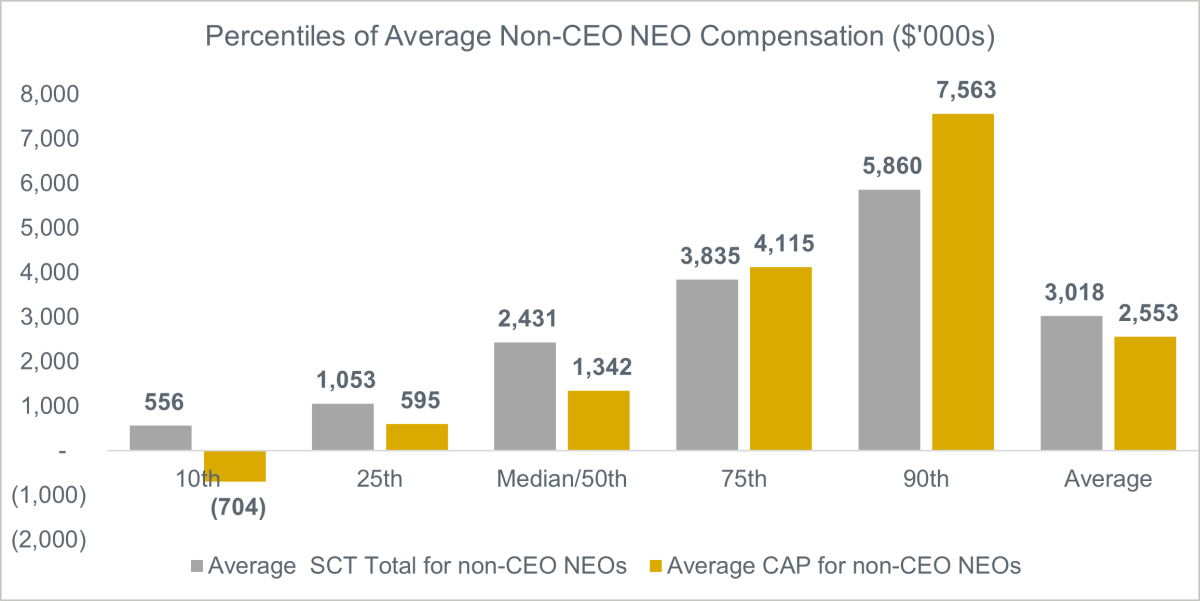
Relationship Between SCT and CAP
Most of the differences between SCT and CAP are driven by swings in stock price and/or payout levels on performance-based equity, as the majority of compensation for NEOs tends to be in the form of equity (whether it be granted, outstanding, or vested in the years represented in the tables). While at most levels, CAP values tended to be lower than SCT for both CEO and average NEO compensation in 2022, at the high end of pay, CAP exceeds SCT.
Conclusions
It remains to be seen how the new PVP disclosure plays out once we have more filers to study. While proxy advisors have indicated they will be watching these disclosures, none have said they will rely on them, at least initially, in making recommendations. Press coverage will no doubt focus on the previously undisclosed CAP numbers, particularly when they are inexplicably higher than SCT numbers, but how they will ultimately be used and whether this disclosure influences compensation decisions remains unknown.